Citi Bike Data Analyses
I downloaded four csv files from www.citibikenyc.com/system-data. These csv files were the months of January, February, July and August data files collected in 2019. I selected those months to make a seasonal category for the data analyses. For example, I used January and February data files for winter, and July and August data files for summer. First, those csv files were imported to Jupyter Notebook. Using Pandas, I merged those files to one csv file. I created a new column named ‘Season’, and put ‘summer’ for July and August data frames and ‘winter’ for January and February data frames. And then, I imported the merged csv file to Tableau.
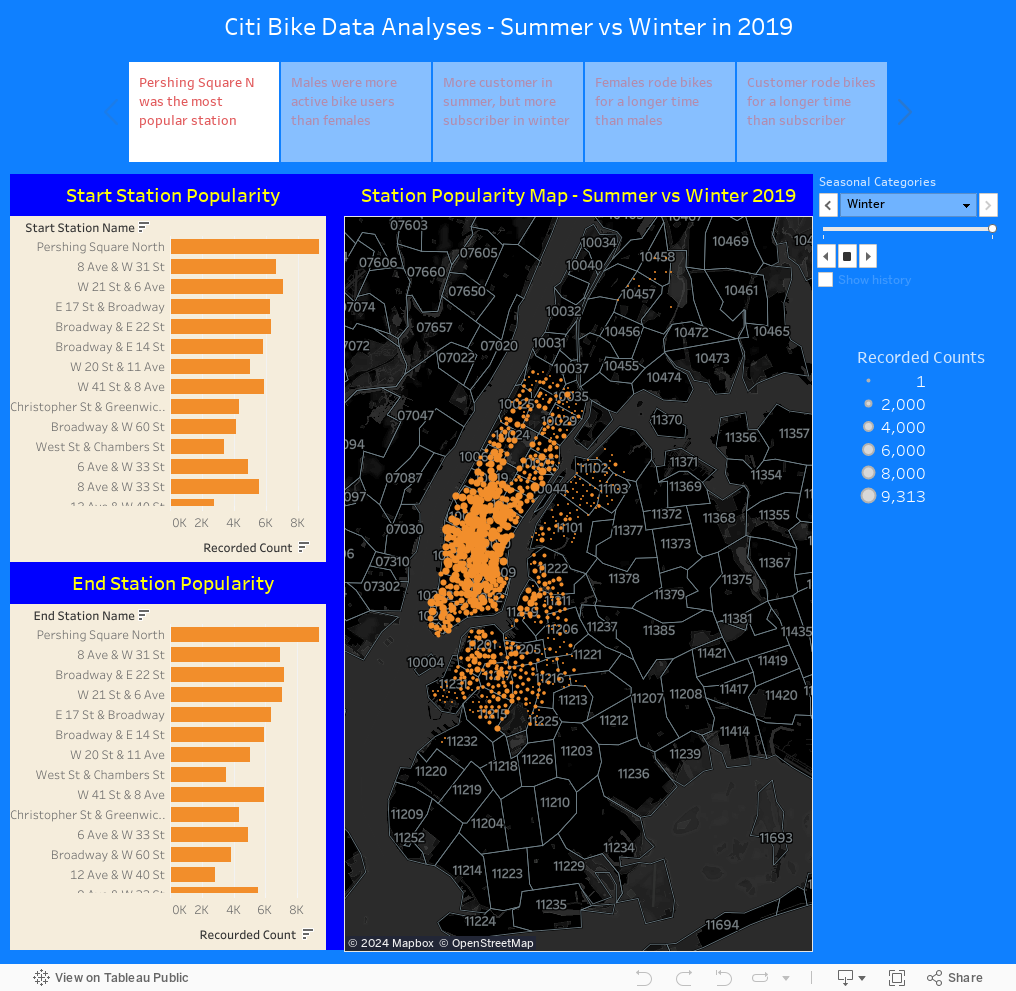
I made a story in Tableau Public to show some data analyses with the Citi Bike dataset. You can change seasonal categories, Winter vs Summer, and click each white box below to explore the Tableau Story!