Data Journalism Project with Census Data and D3 Graphics
Using the D3 techniques, I created a scatter plot that represented each state with circle elements. I imported 2014 Census data by using the d3.csv function. I included state abbreviations in the circles with a "selectAll.("null")" function. I used the rate of poverty, median income, and median age as x variables, and the rate of lack of healthcare, obesity rate, and smoking rate as y variables. Also, I incorporated d3-tip to reveal a specific element's data, and added tooltips to all circles.
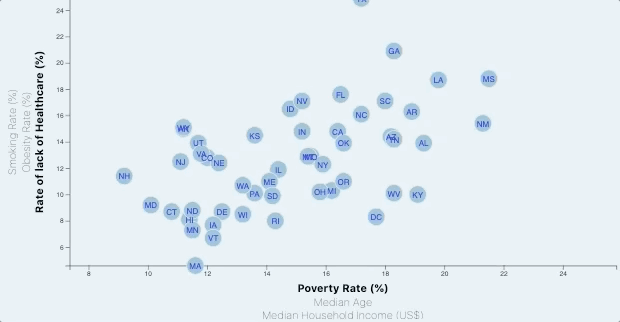
1) Correlations Discovered Between Lack of Healthcare and Poverty, Age, and Income
There was a strong, positive correlation between lack of healthcare and the poverty rate (R=0.52). Additionally, moderate, negative correlations were observed between lack of health care and median age (R=-0.38), and the household income (R=-0.43) in states.
2) Correlations Discovered Between Obesity, and Poverty and Income
There was a positive correlation between the rate of obesity and the rate of poverty (R=0.46). A strong, negative correlation was found between the rate of obesity and the median household income (R=-0.43), but not between the rate of obesity and median age (R=-0.007).
3) Correlations Discovered Between Smoking Rate and Poverty, Age, and Income
There was a strong, positive correlation between the rate of smoking and the rate of poverty (R=0.52) and the median age (R=0.25). A strong, negative correlation was observed between the rate of smoking and household income (R=-0.66)